Gain Visibility of Your Software Ecosystem
The Hidden Cost of Software Disorganization
Mid-sized companies typically lose track of 15-20% of their software investments—tools forgotten when employees leave or departments change. With 30-40% of licenses sitting unused and renewal surprises hitting budgets quarterly, the average company wastes thousands on software nobody uses while teams struggle with poor-fit tools that drain your budget in plain sight.
How Evale Transforms Your Software Management
Comprehensive Discovery Beyond the IT Department
We uncover your complete software landscape—not just what IT knows about. Our structured interviews with C-level and department heads reveal the full picture, while automated surveys catch those "personal" tools teams use without central approval.
- We survey your team—starting with C-level or IT leads—to uncover all tools in use, mapping relationships between them that spreadsheets miss
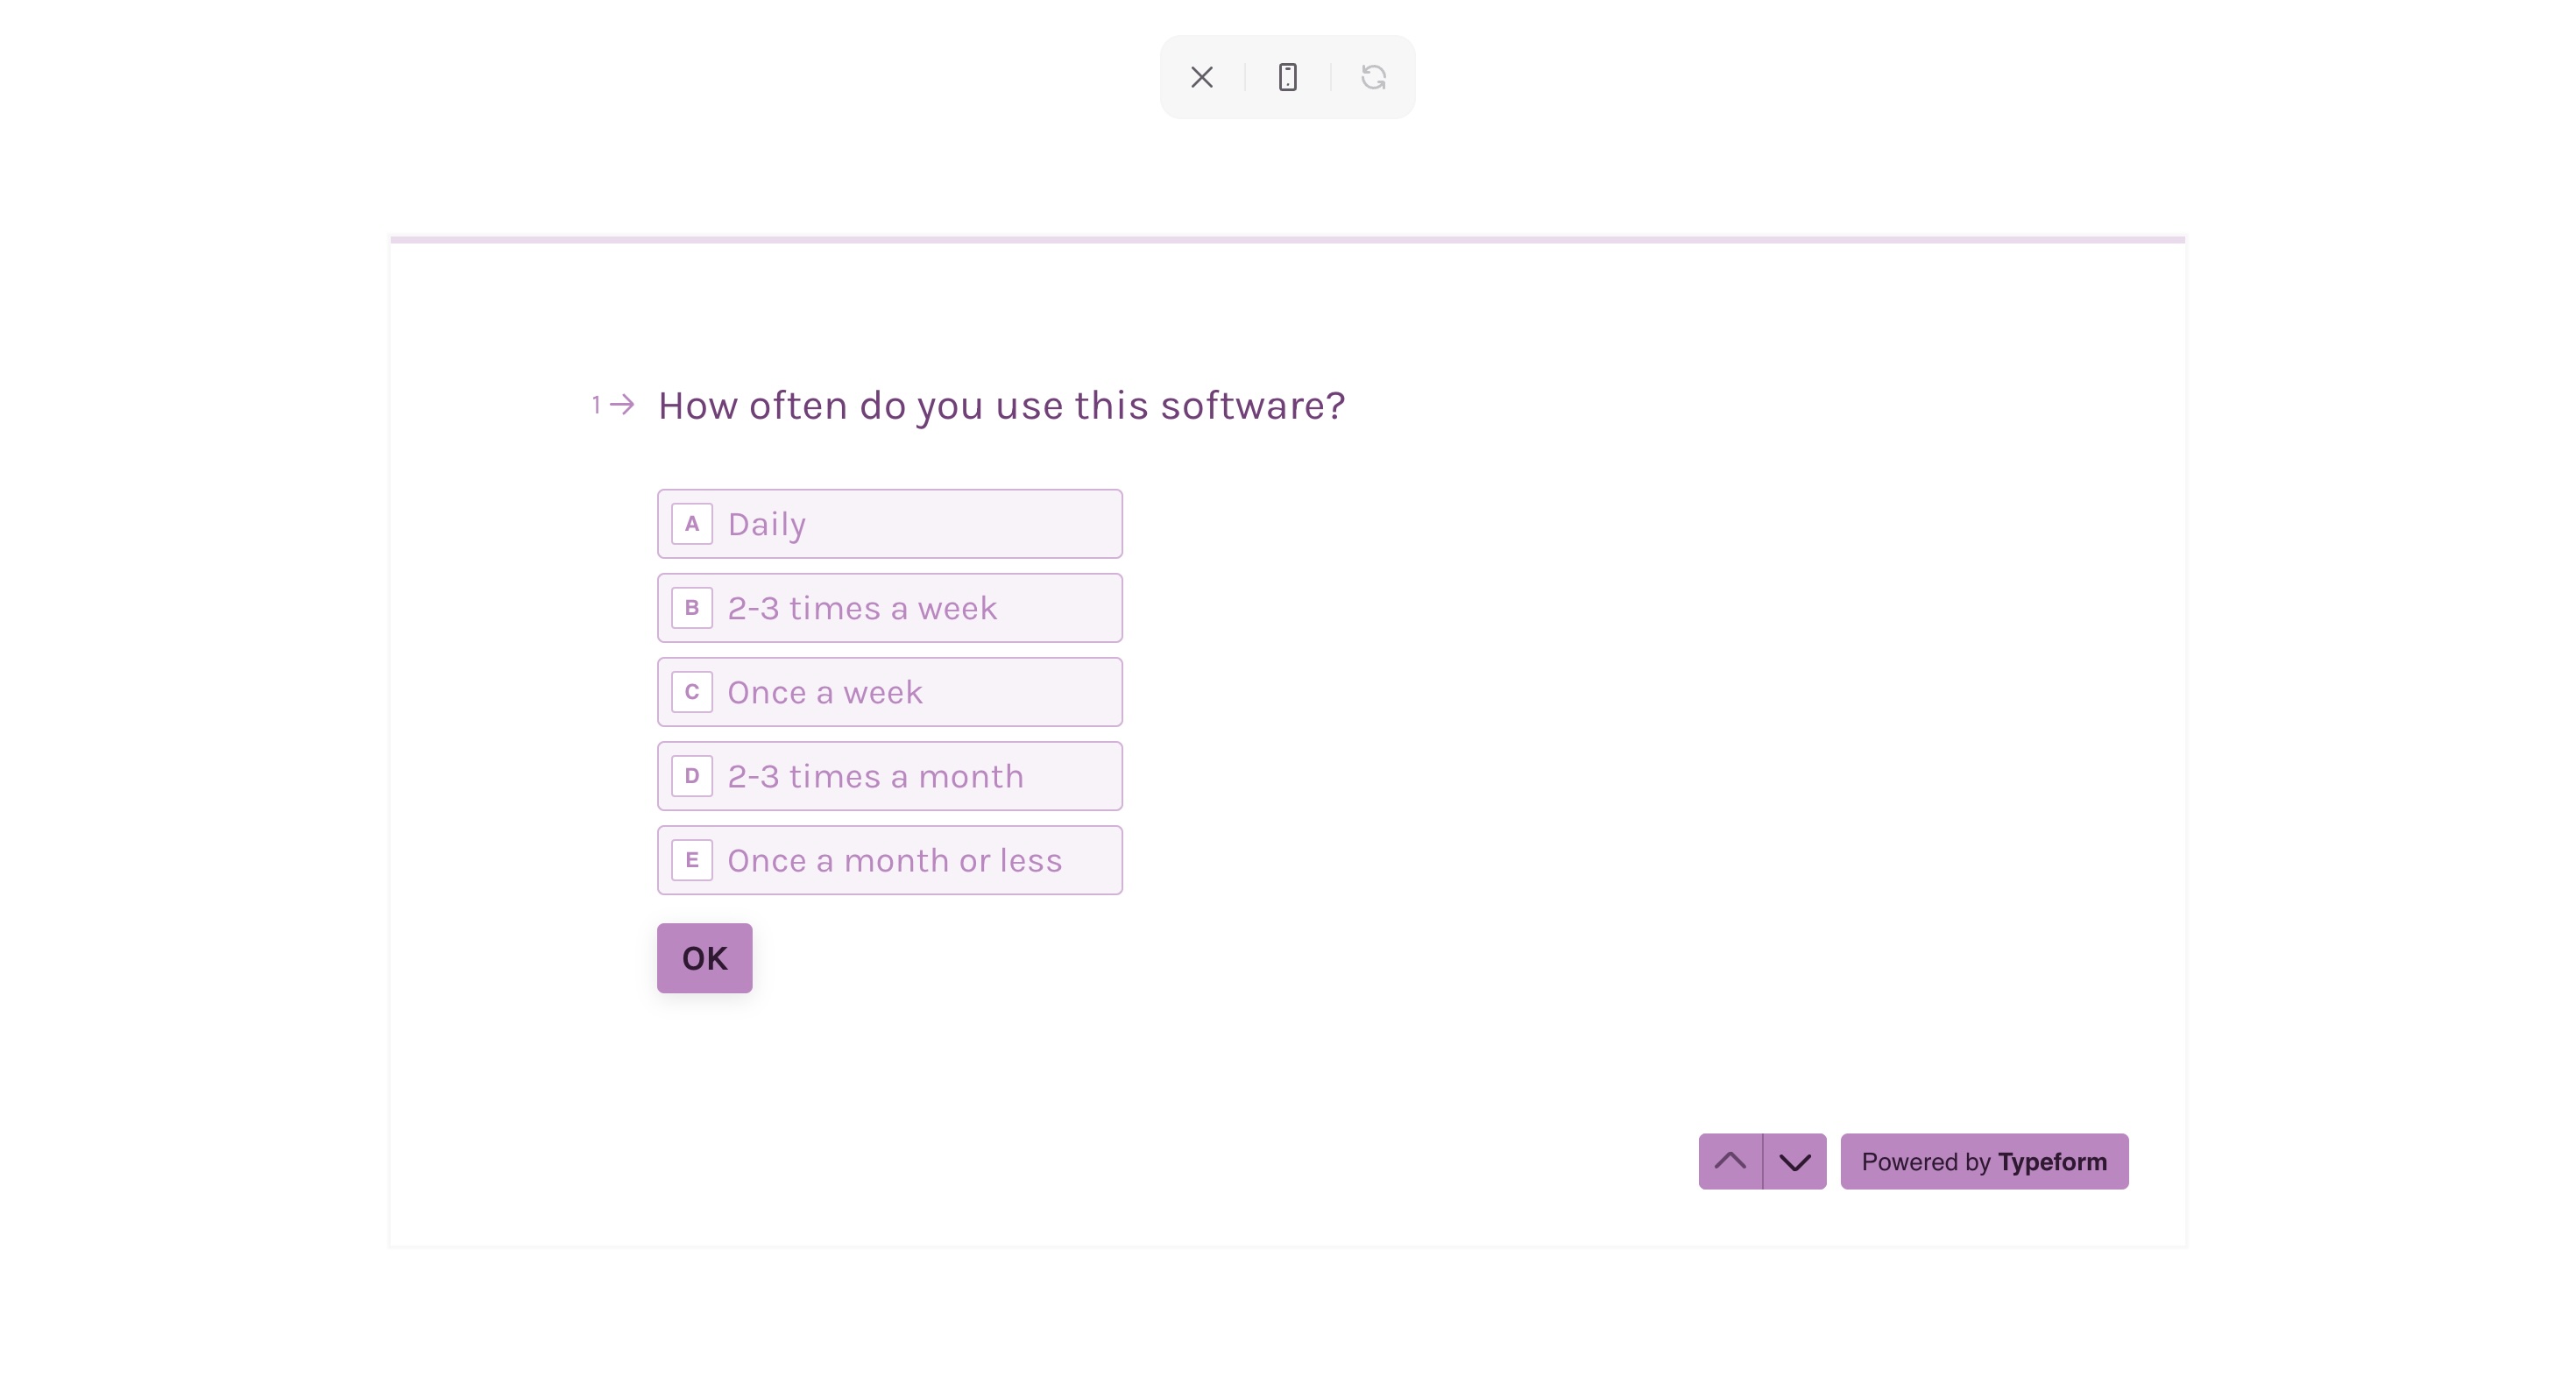
- Our 15-minute surveys identify shadow IT purchased outside procurement, revealing the truth behind what's actually being used
- Department interviews expose missing integration points and workflow gaps between tools that create hidden inefficiencies
- The result is a complete visualization of your stack's health, showing exactly which $20K subscriptions have 0% meaningful usage
Team Usage Analysis That Reveals True Adoption
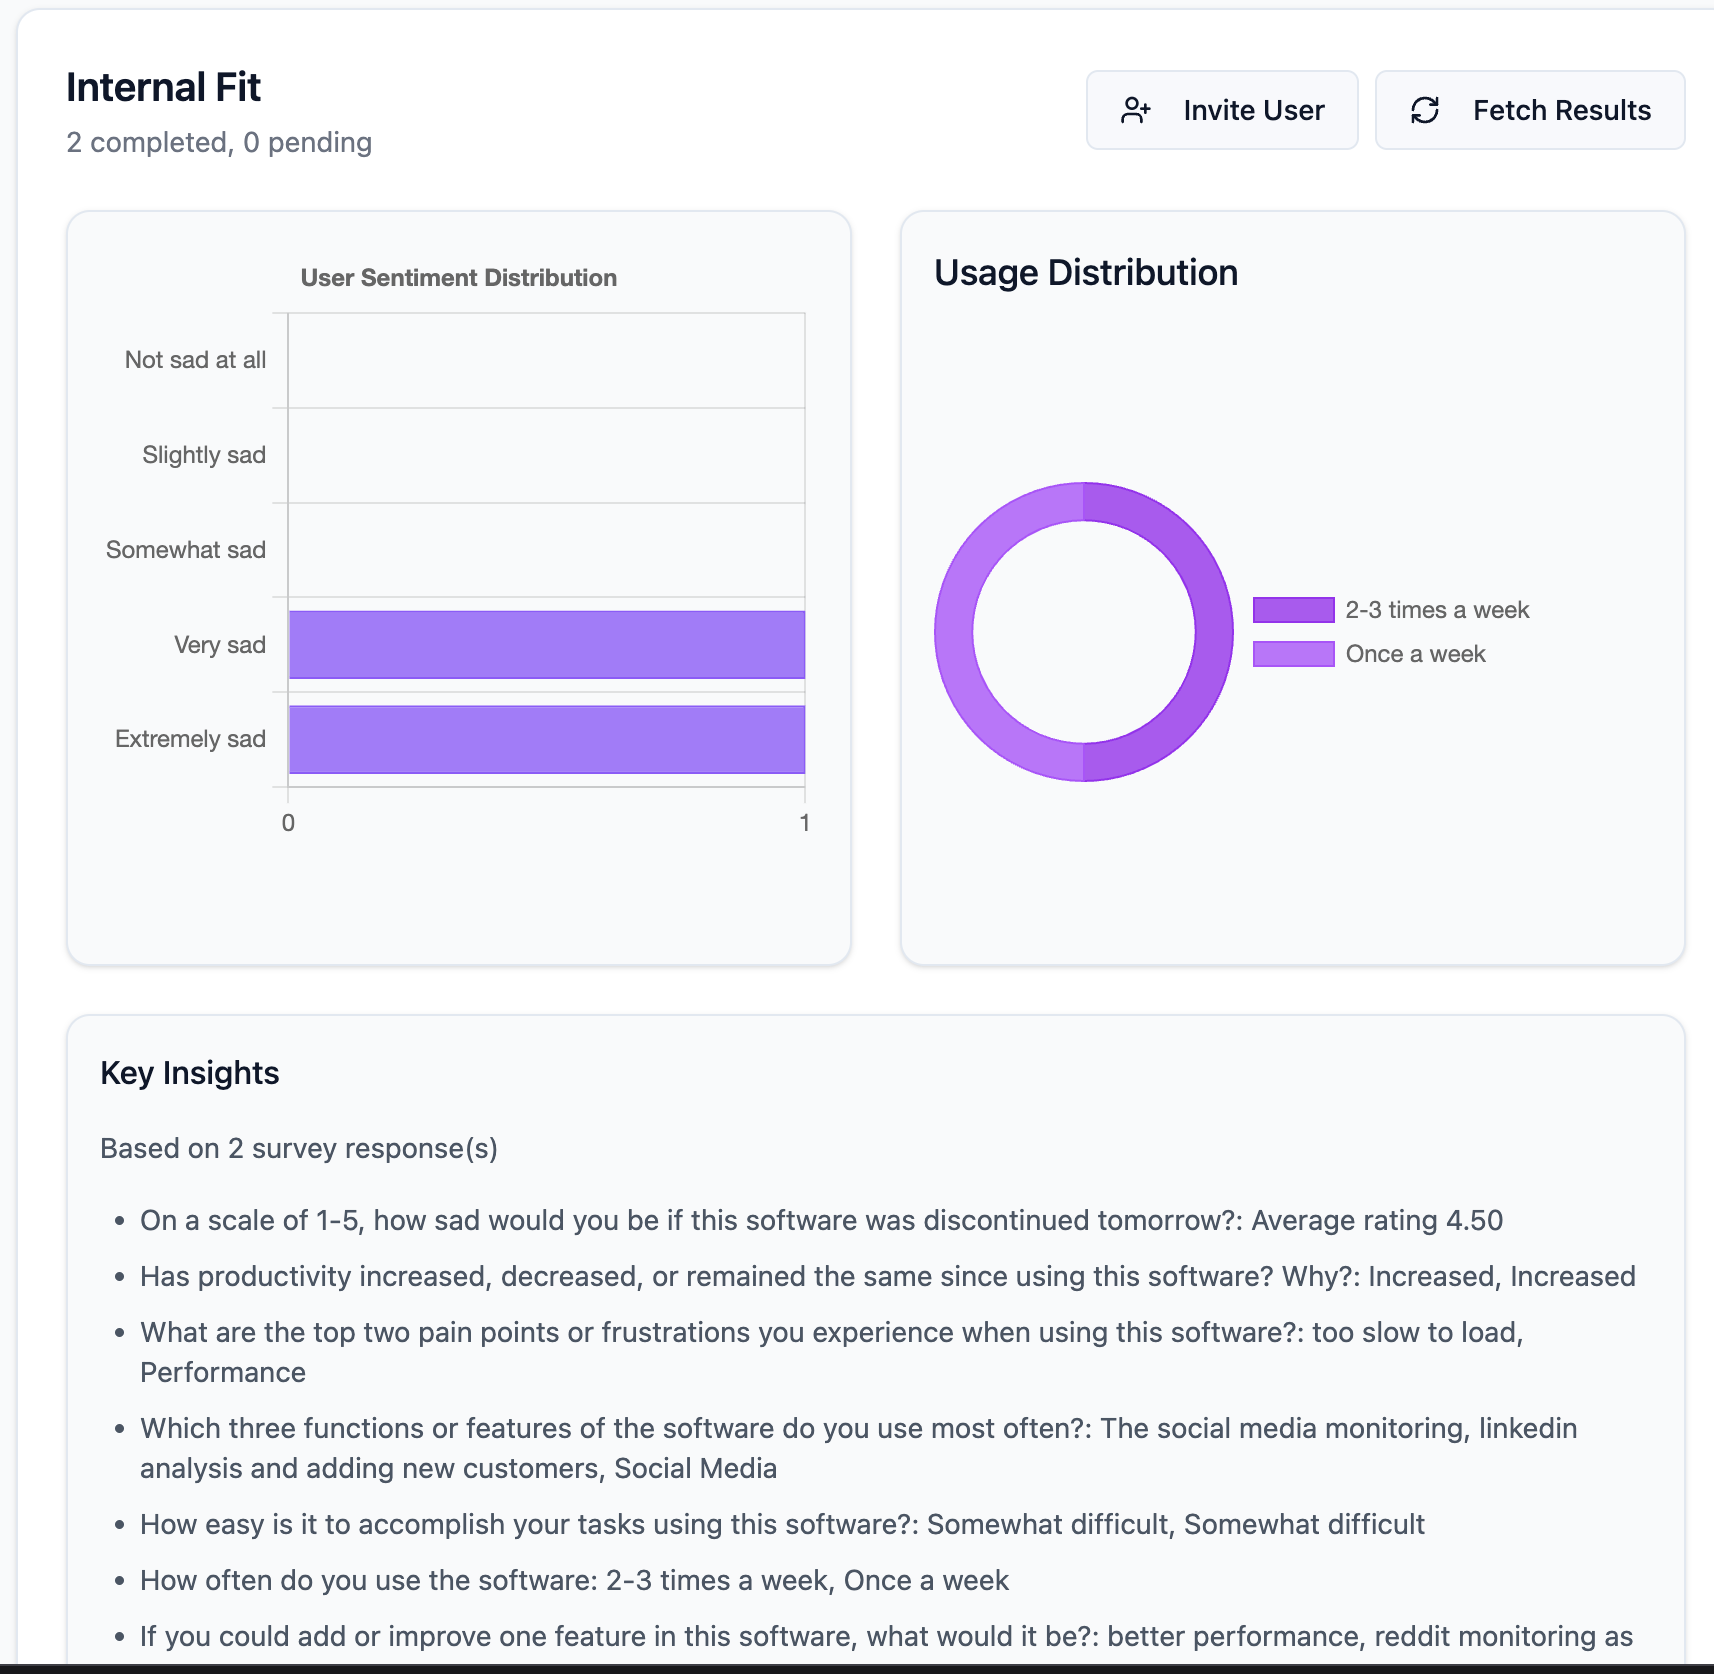
Beyond basic "yes/no" usage statistics, we capture how deeply teams engage with tools—from "login once a month" to "mission-critical daily use." Our surveys measure satisfaction on a 5-point scale alongside qualitative feedback to reveal whether low adoption stems from training gaps or poor tool fit.
- We score tools on both satisfaction (using a 5-point scale plus open-ended questions) and vendor robustness (using market data)
- Usage heat maps across departments show exactly where your tech stack shines and where it's collecting dust
- Adoption patterns reveal whether training investment or replacement is the right solution for underperforming tools
- You'll uncover the real story behind user complaints—is it the tool itself or implementation that's falling short?
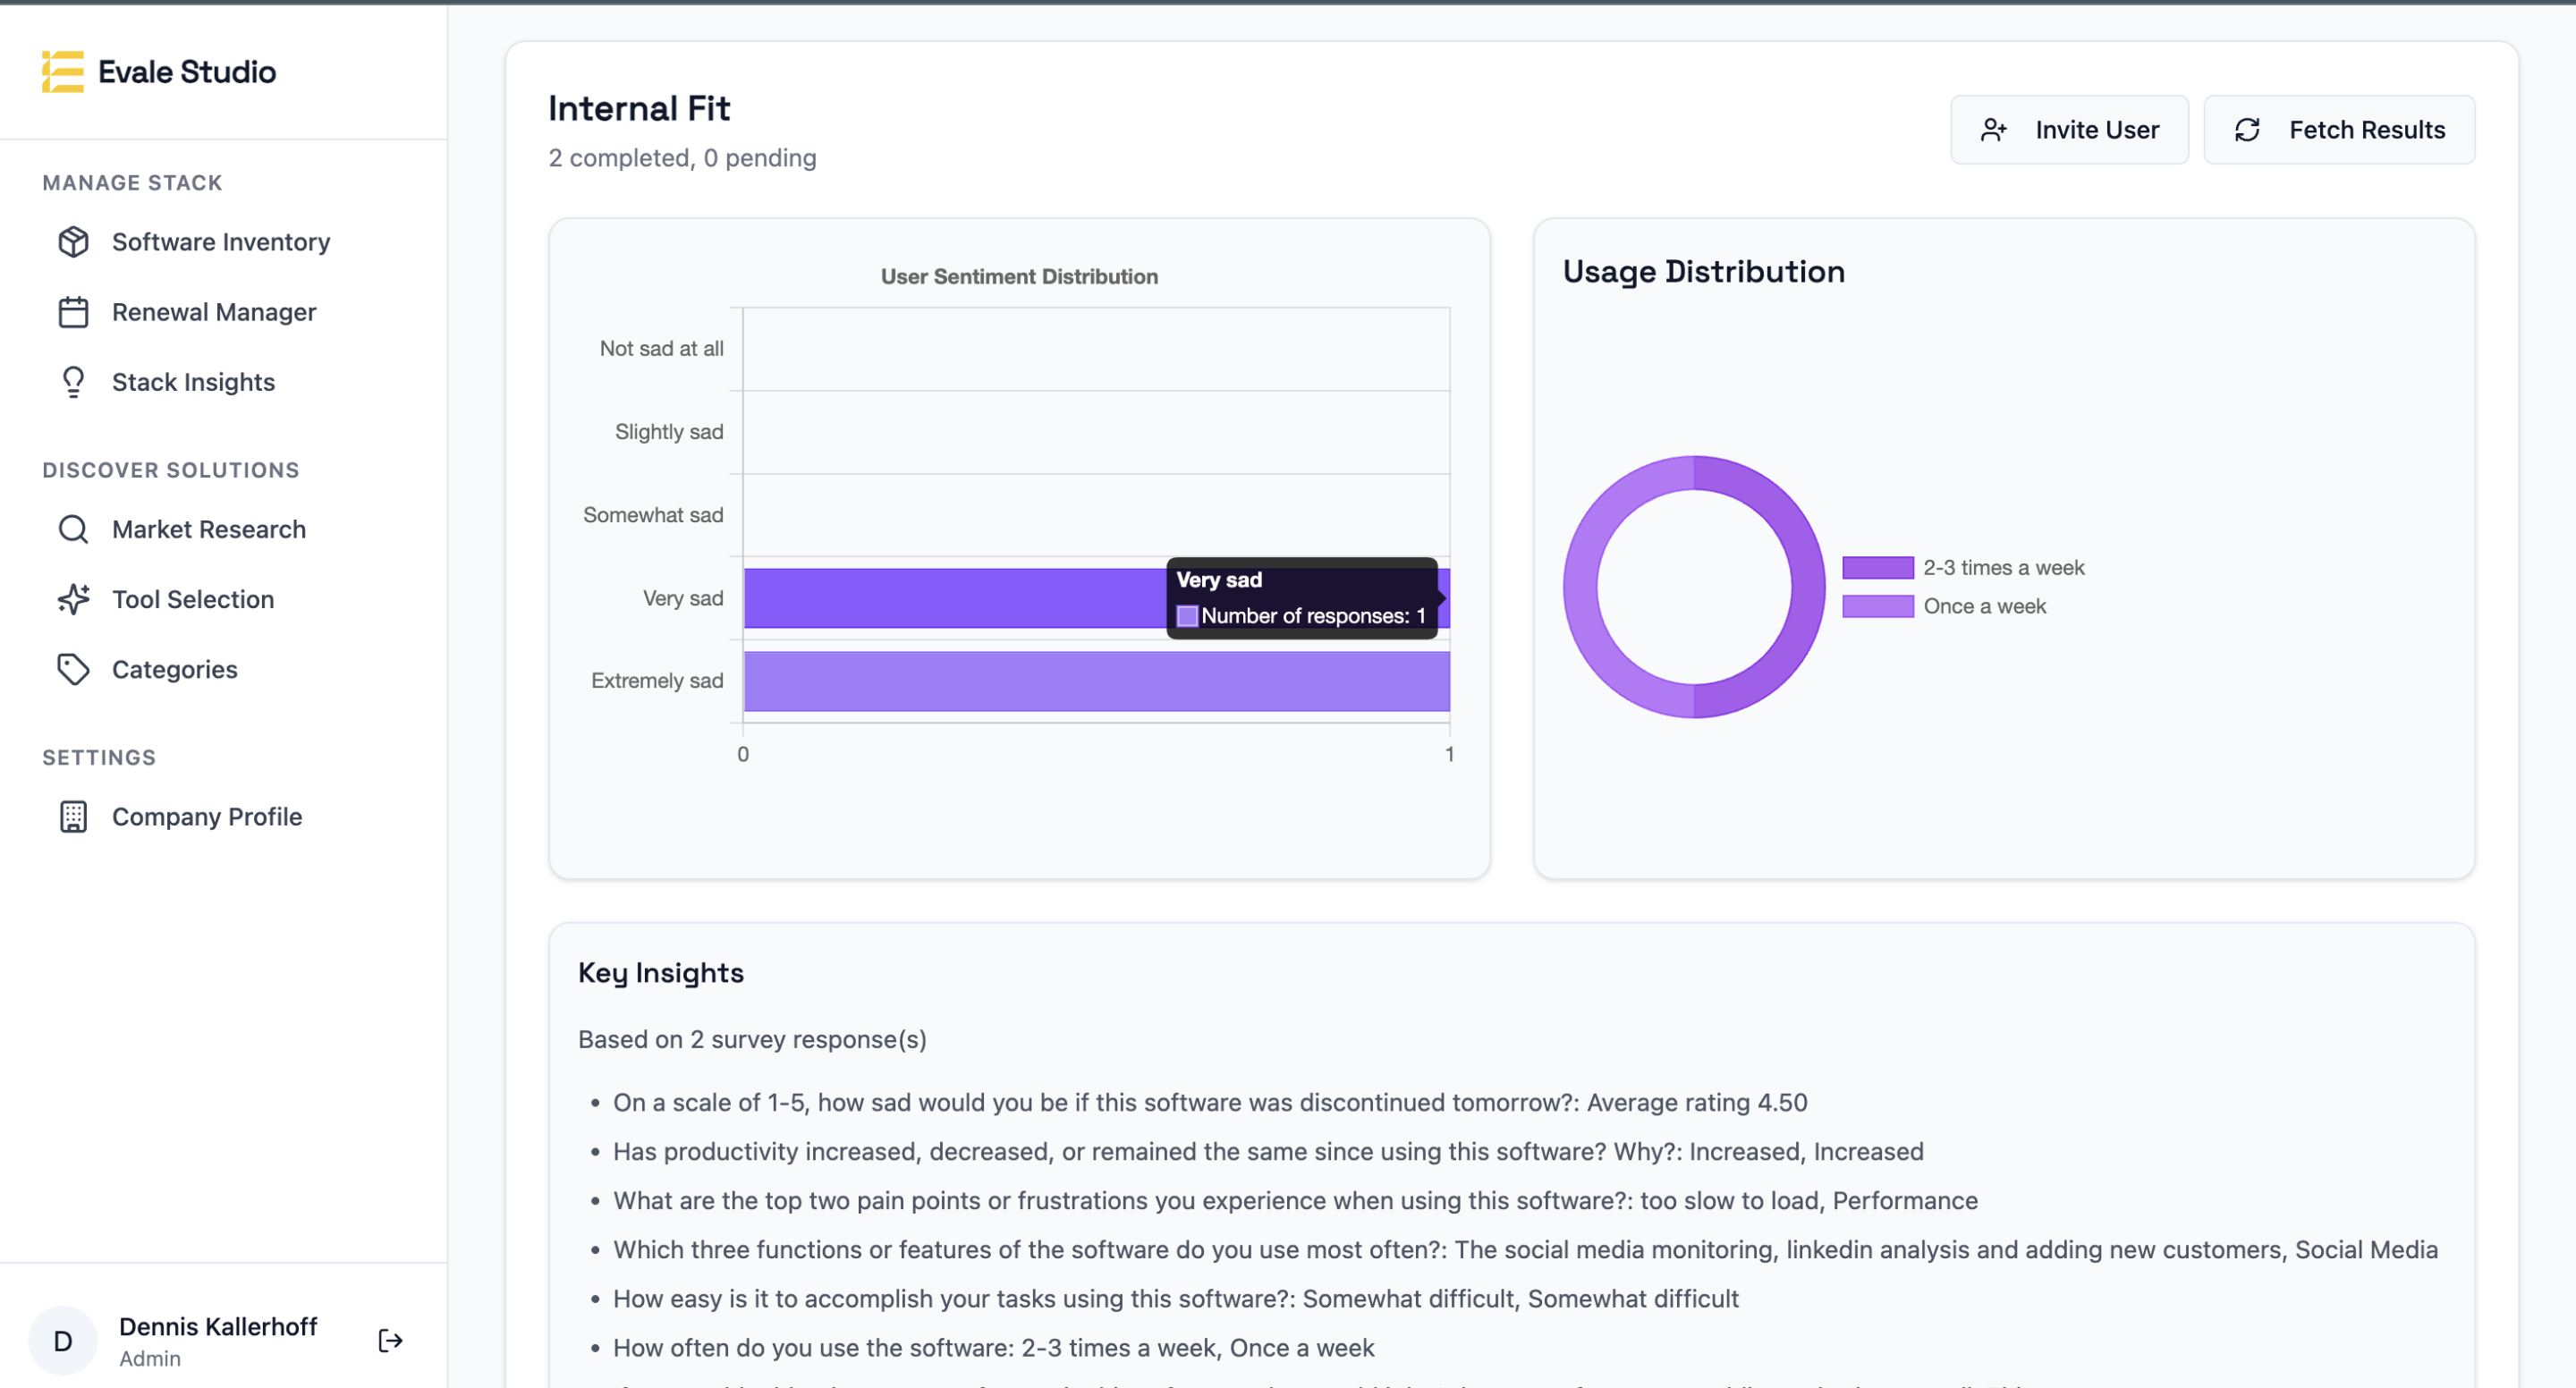
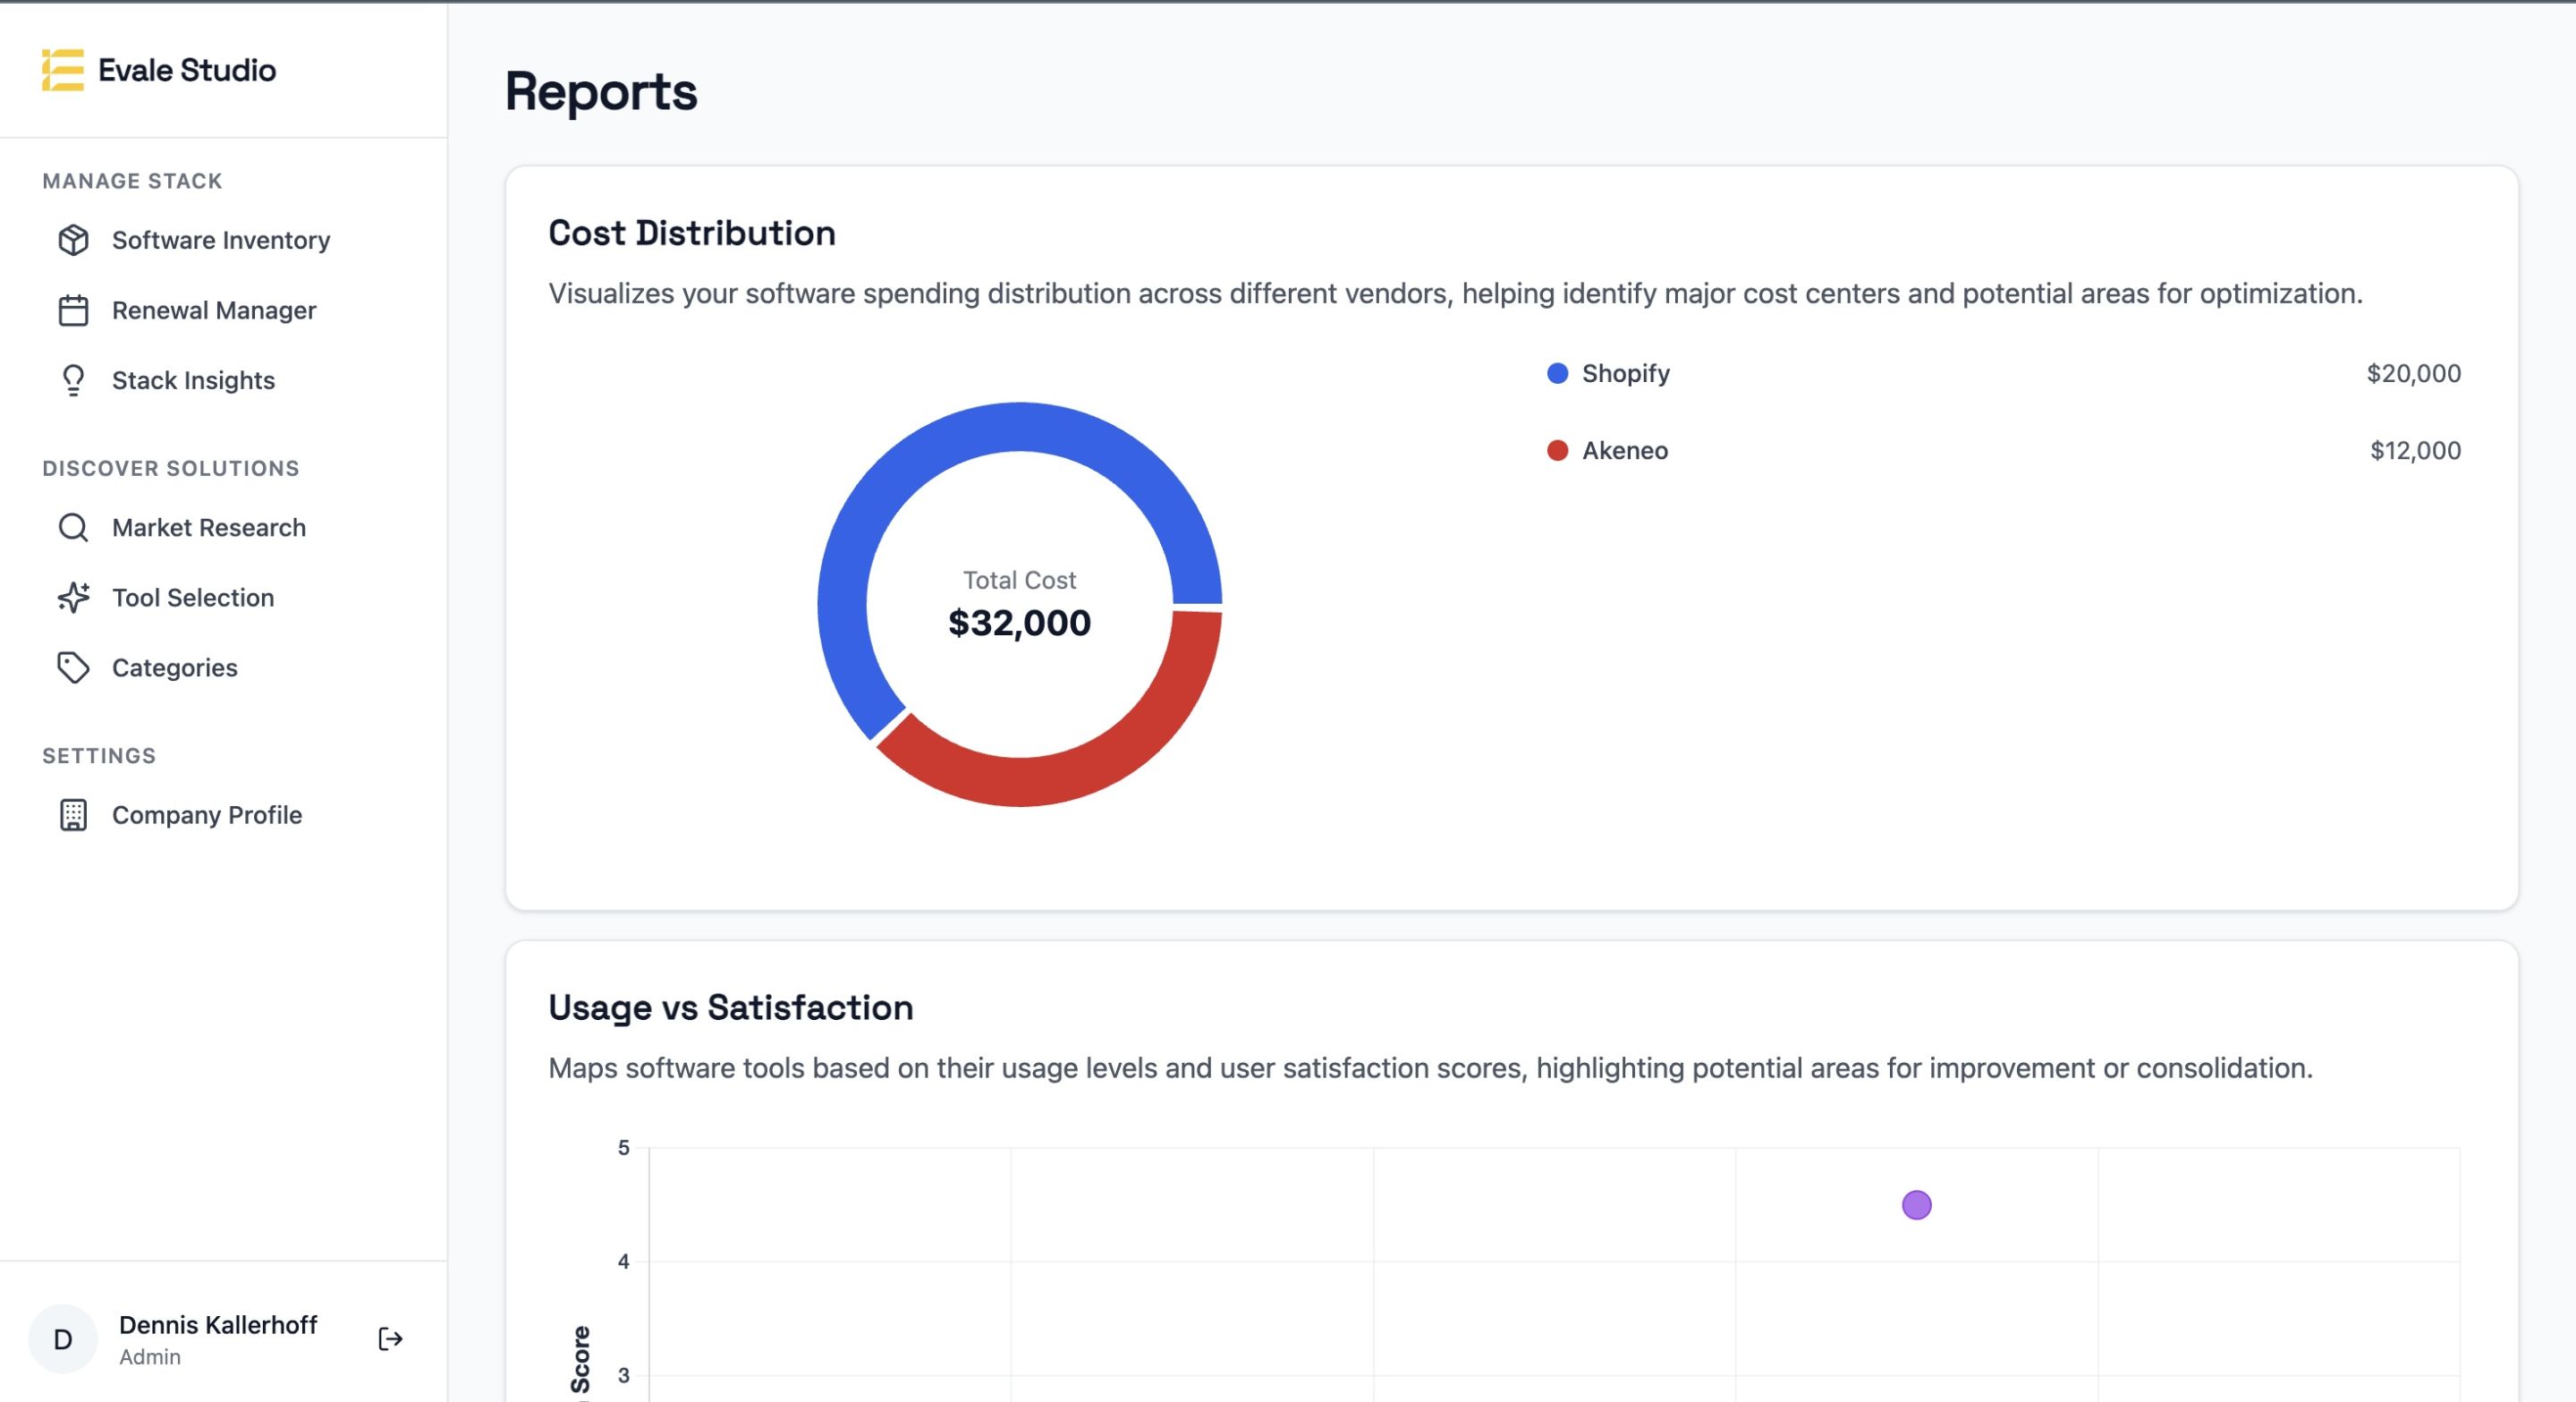
Actionable Reports That Reveal the Full Picture
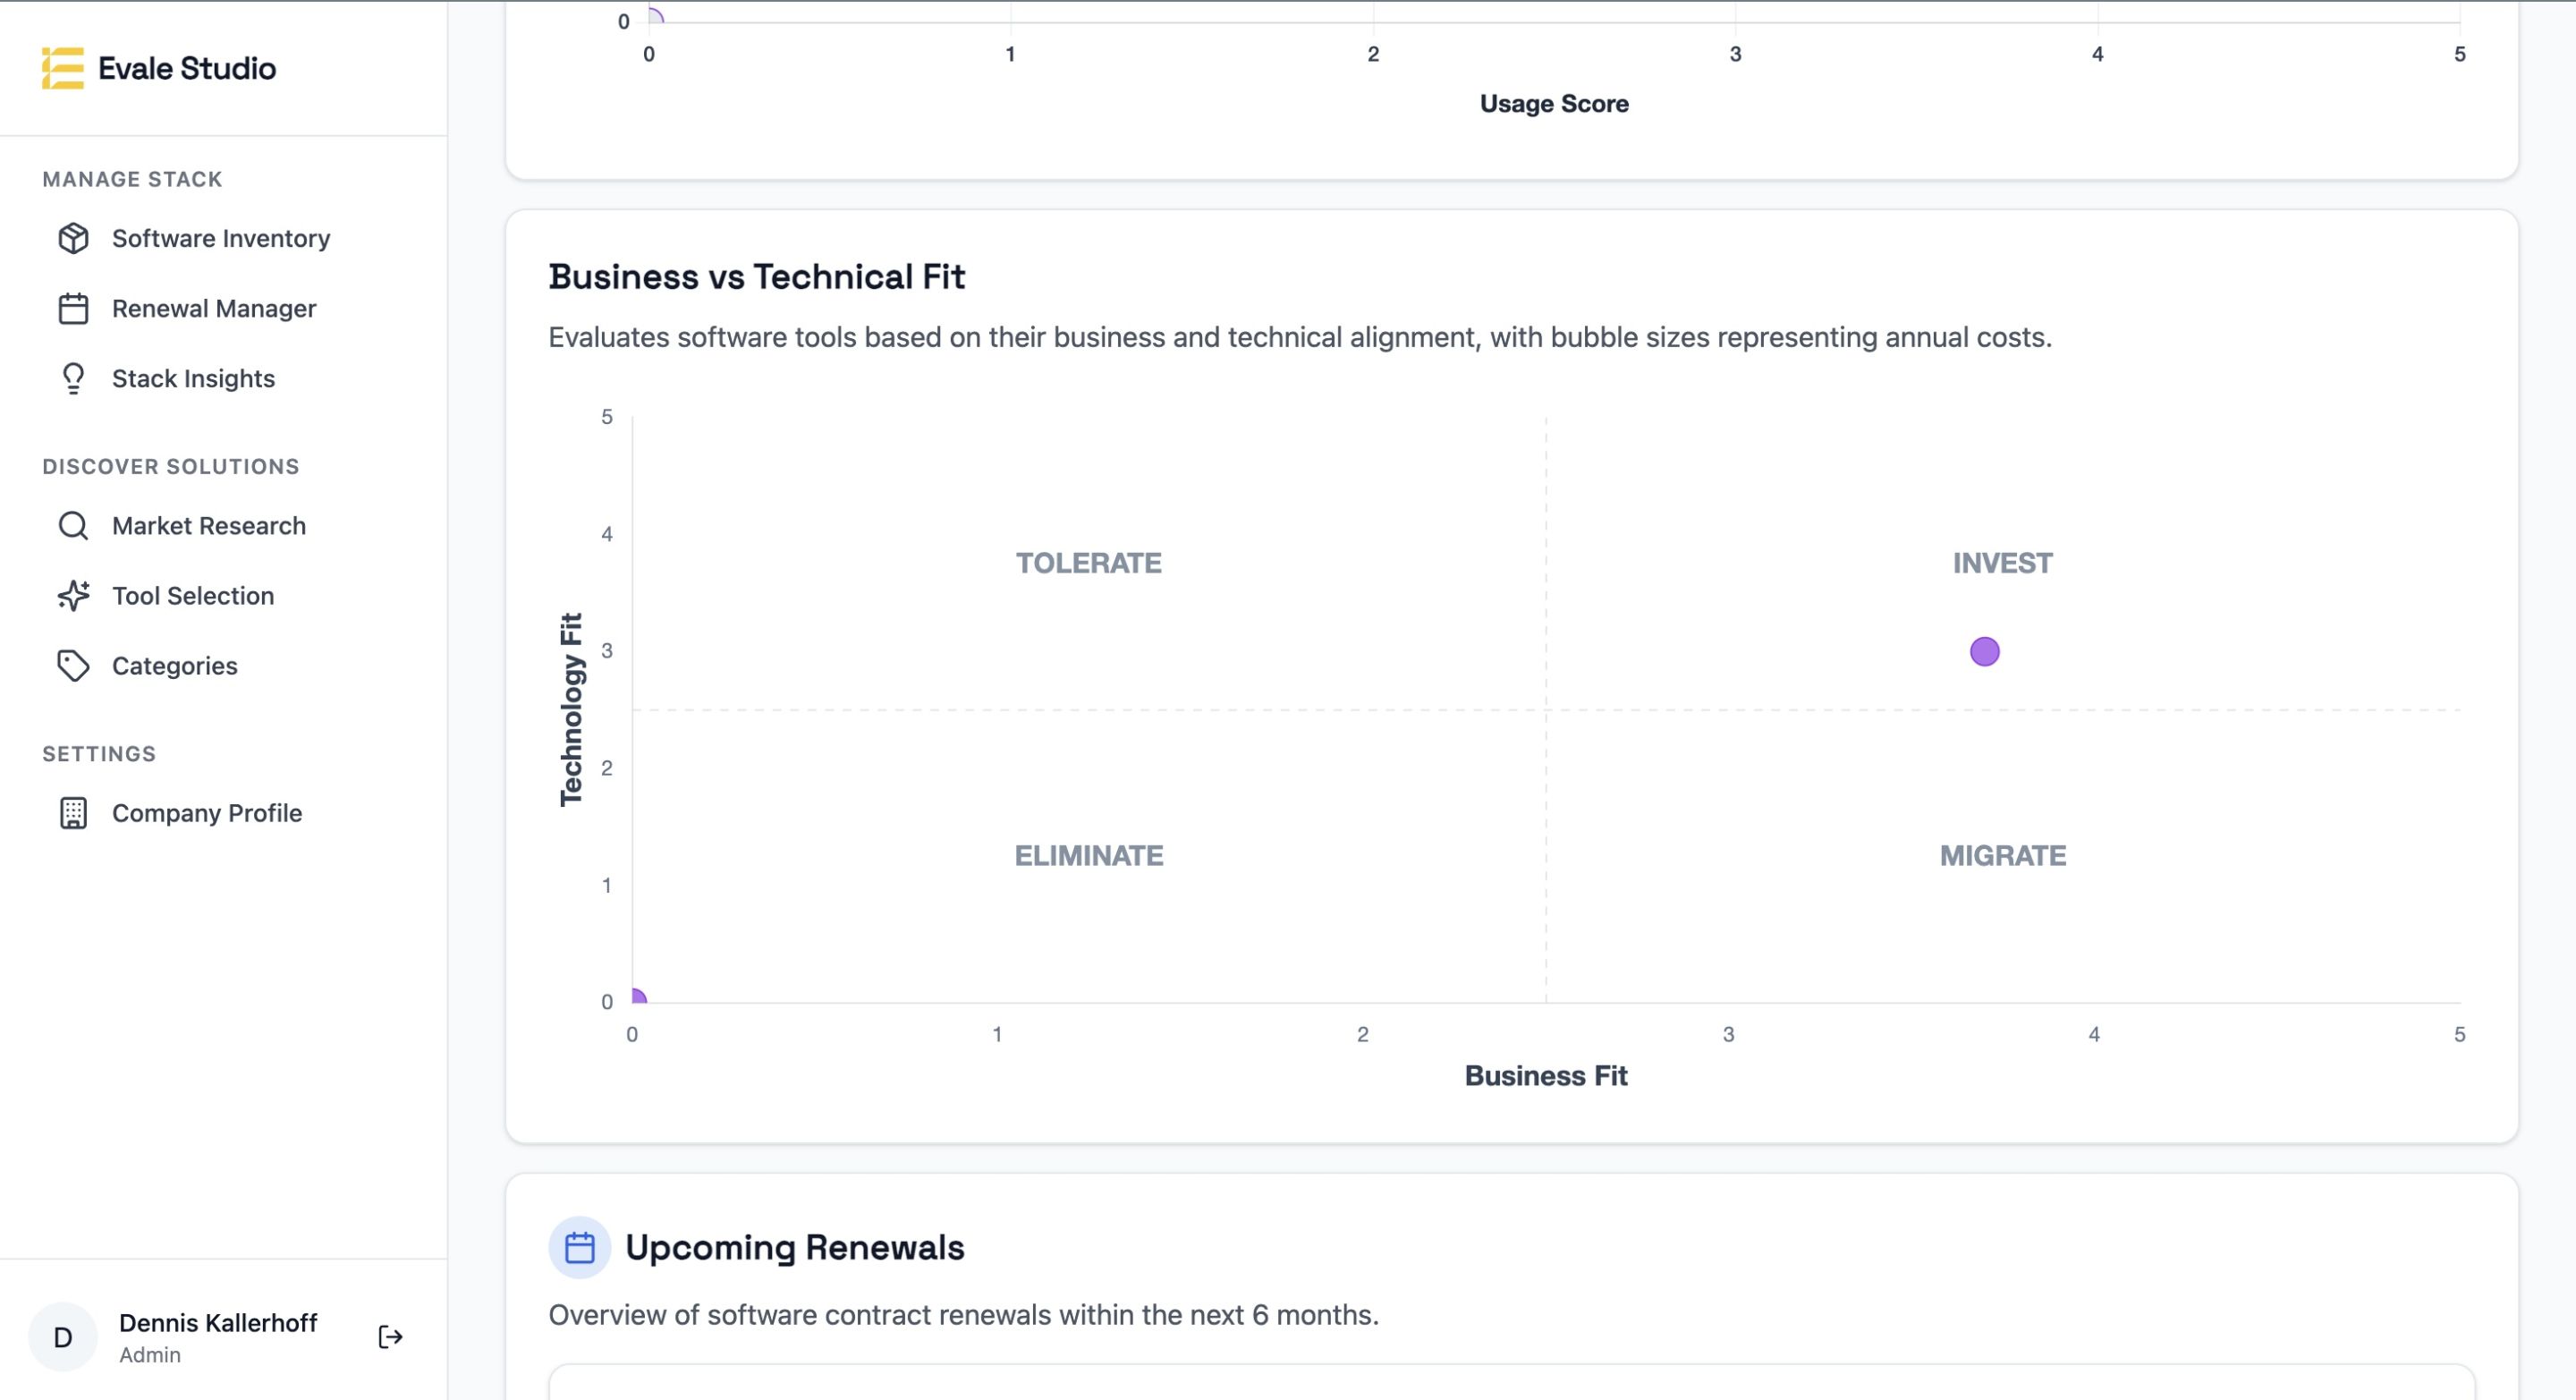
Our visual reports transform complex data into clear decisions that drive immediate action. We classify tools into actionable categories (keep/review/replace/consolidate) and prioritize recommendations by impact and implementation difficulty.
- Correlation dashboards (usage vs. satisfaction, cost vs. value) spotlight the real story behind your stack
- Concrete metrics break down total spend ($20K on Shopify), usage rates (0% on 7 licenses), and functional overlap
- Prioritized recommendations show where to focus first—like cutting a rarely-used $20K renewal or consolidating three project management tools
- One-pagers provide executive summaries for each tool, perfect for renewal negotiations or replacement discussions
Cost Optimization Through Overlap Analysis
We analyze your total cost of ownership—not just license fees but implementation and support costs. Our overlap analysis spots redundant functionality and identifies right-sizing opportunities to cut 10-20% from your SaaS budget without losing capability.
- We identify functional overlaps across departments where you're paying twice for the same capabilities
- License utilization audits reveal opportunities to downgrade plans or reduce seat counts
- Renewal timing analysis helps you bundle negotiations for better leverage with vendors
- Typical clients save 10-20% on their software spend—that's $30K-$60K on a $300K annual budget
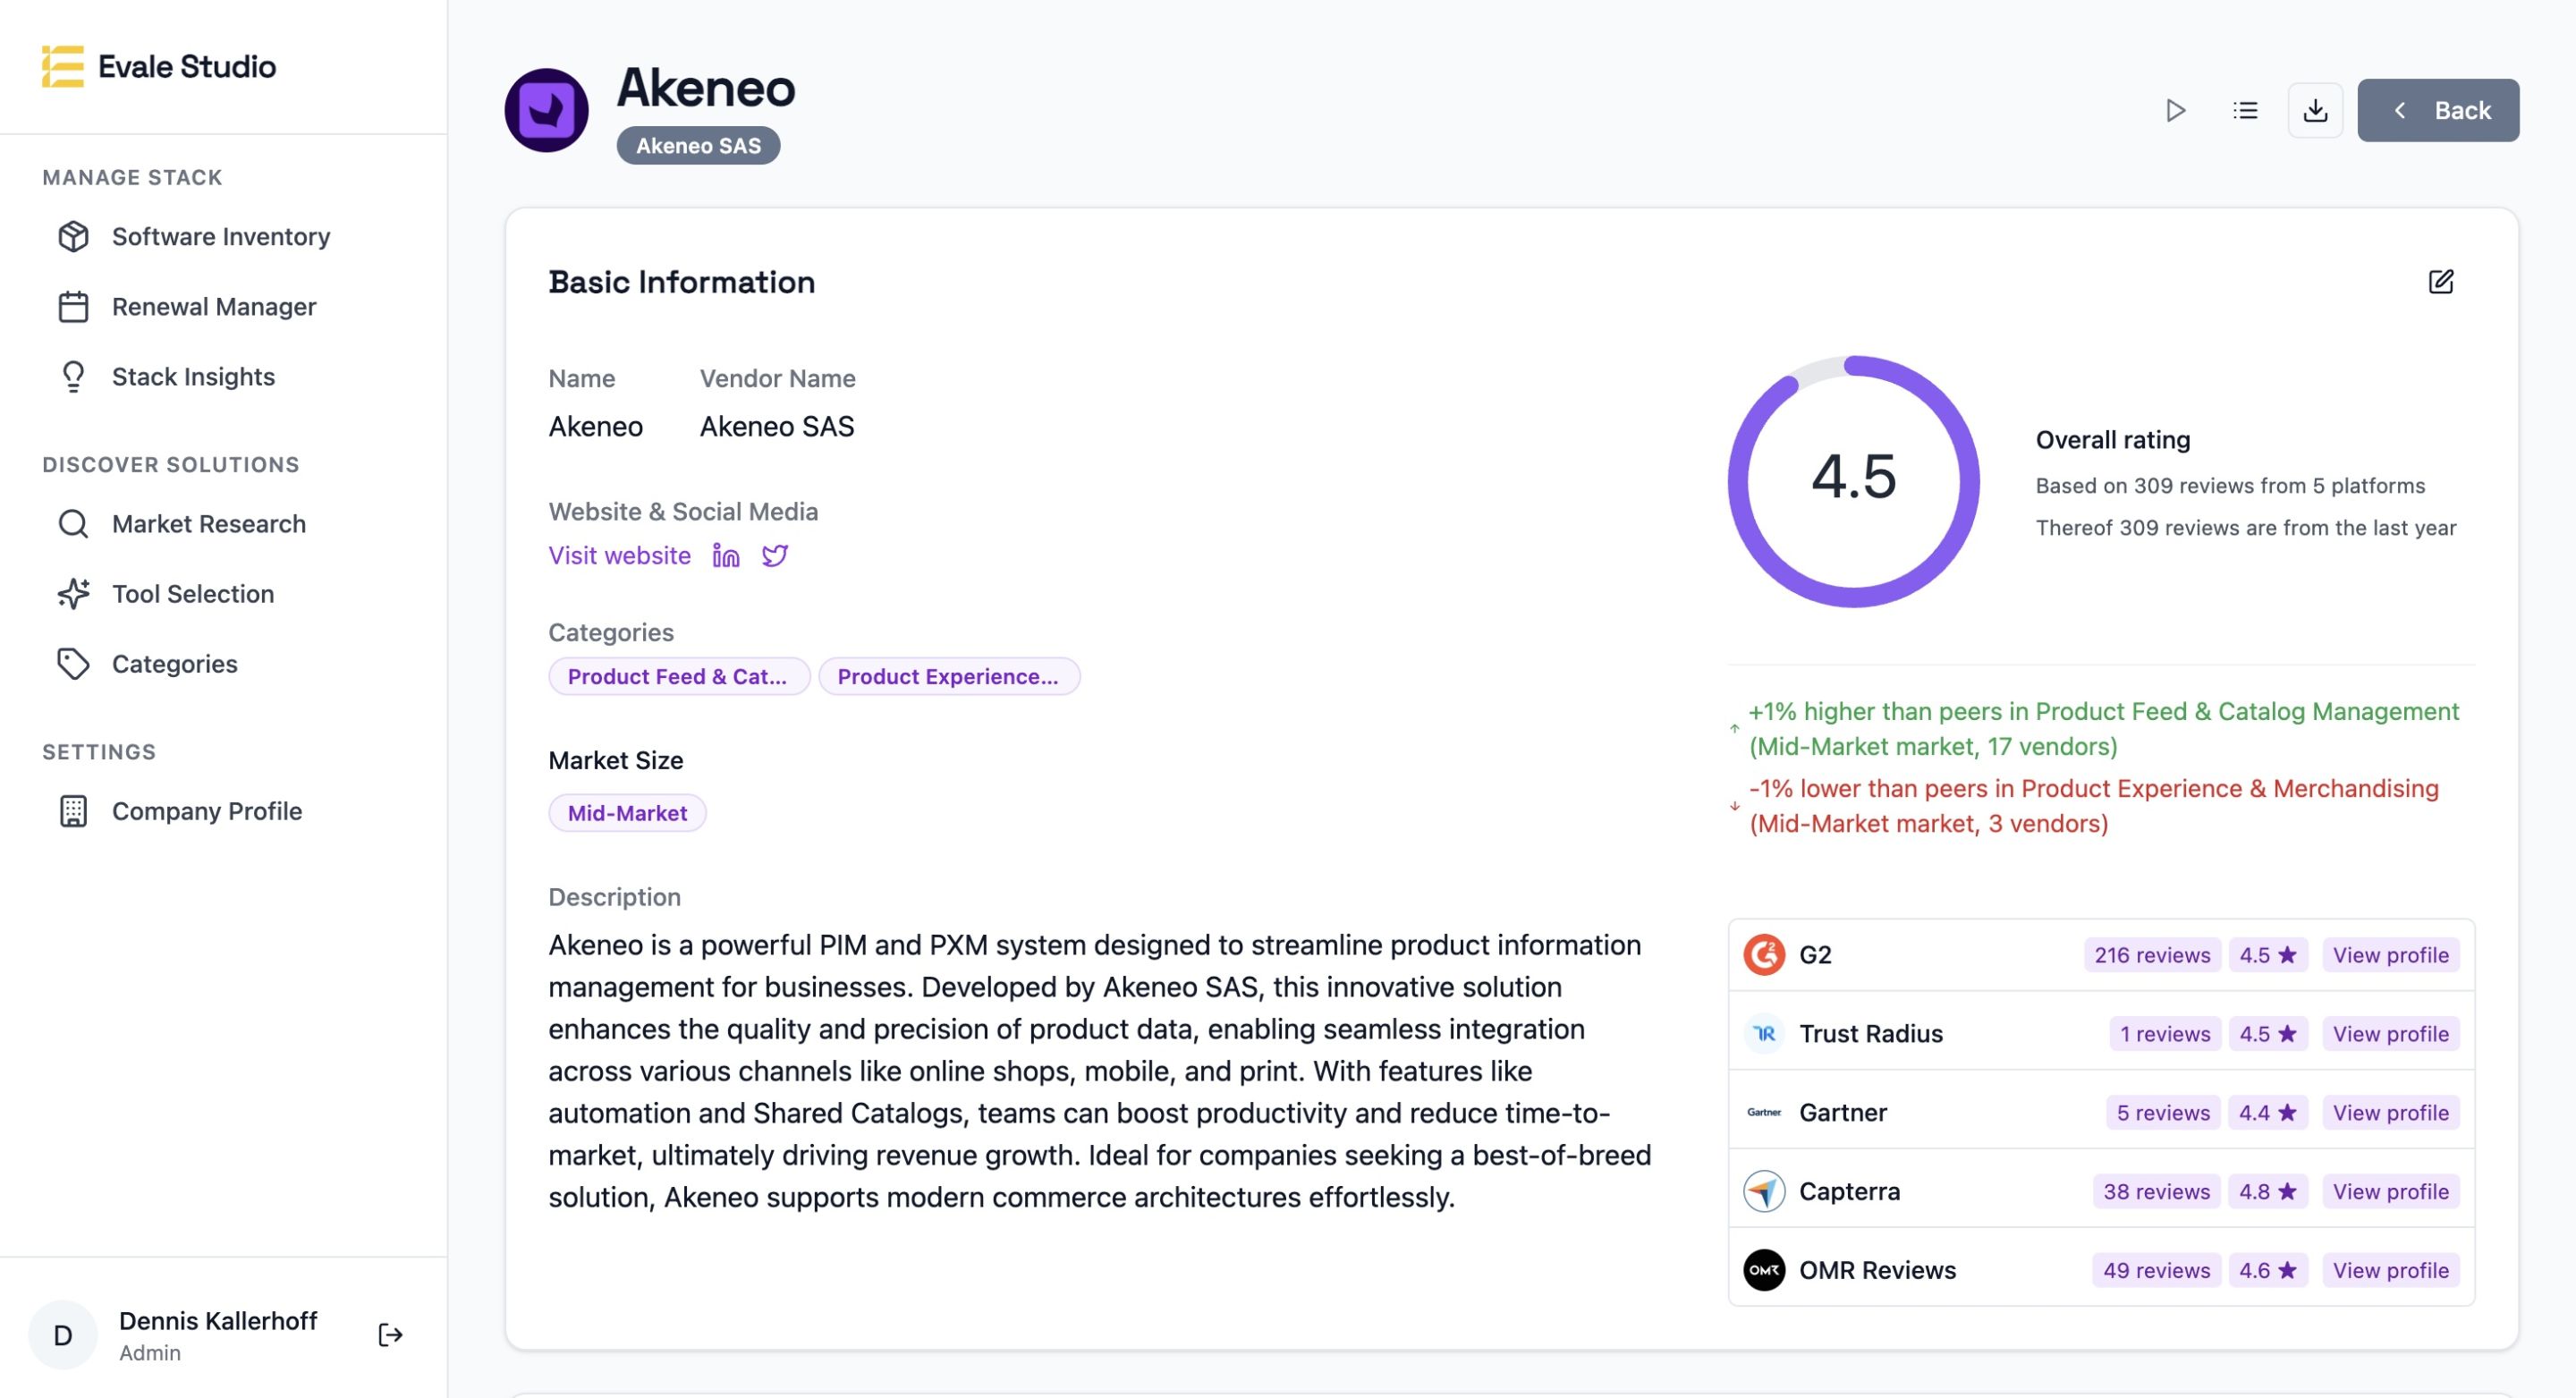
Market Context That Transforms Internal Data
We enrich your stack data with market intelligence on 1,000+ vendors to inform your keep/replace decisions. Is Shopify's momentum steady while Akeno's fading? These trends help prioritize migrations from declining platforms and spot opportunities to consolidate.
- Vendor profiles combine product documentation, support quality metrics, and user review analysis
- Market momentum tracking reveals which vendors are gaining or losing traction in your industryWe generate structured vendor briefings that translate your needs into questions vendors can’t dodge with vague promises.
- Pricing transparency assessments help you avoid vendors known for problematic pricing practices
- Our expert analysis translates market shifts into practical recommendations for your specific situation
Our process
Smart Data CollectionAnalysis
Analysis & ValidationWeek 2
RecommendationsWeek 2
FAQs
How much time will my team need to invest in the process?Q1
How do you uncover shadow IT that doesn't show up in our procurement systems?Q2
What if we don't know how much we're spending on certain tools?Q3
How do you handle sensitive information about our software stack?Q4
What makes your analysis different from what our IT team could do internally?Q5
What our customers are saying

The SaaS market is a labyrinth. Software is becoming more complex and the market more confusing. Evale’s methodical approach simplifies the selection of software and is also cost effective.